pup matplotlib marker
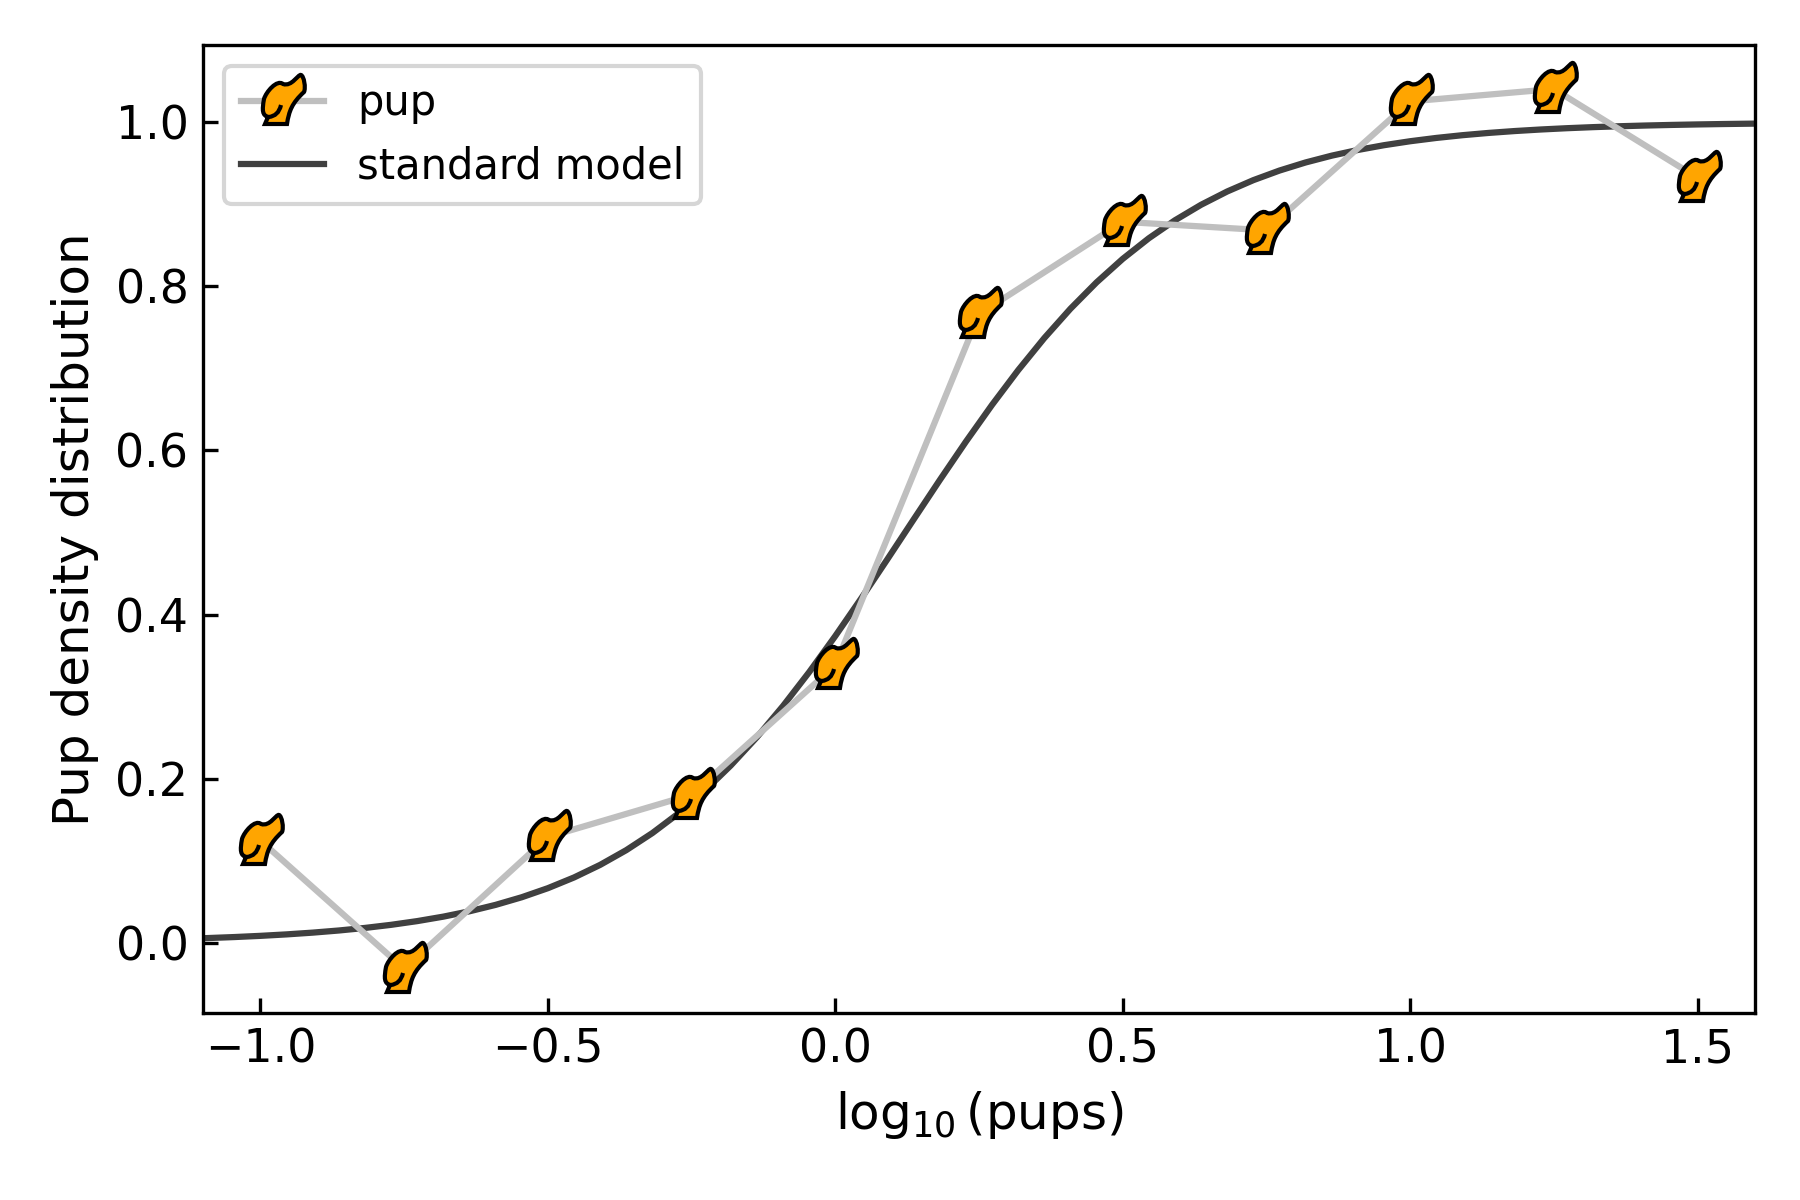
Importing puppies automatically enables the user to make Matplotlib plots with a pup marker. See for example the Python script below:
# Plot with pup markers:
import puppies as p
import scipy.constants as sc
import scipy.integrate as si
import matplotlib.pyplot as plt
import numpy as np
plt.ion()

# Some random curve:
T = 273.0
mu = 0.1214 * sc.electron_volt
pups = np.linspace(-1.0, 1.5, 11)
np.random.seed(10239)
z0 = 1.0 / (1.0 + np.exp((mu-pups*sc.electron_volt)/(10*sc.k*T)))
z = np.random.normal(z0, 0.1, len(pups))

# Expected model:
t = np.linspace(-2, 2.5, 100)
def comp_fermi_dirac_int(t,x):
    return 1.0/(np.exp(t-x)+1)
model = np.array([
    np.exp(-si.quad(comp_fermi_dirac_int, 0.0, np.inf, args=(x,))[0])
    for x in (mu-t*sc.electron_volt)/(10*sc.k*T)
    ])

fig = plt.figure(0)
fig.set_size_inches(6, 4)
plt.clf()
ax = plt.subplot(111)
ax.plot(pups, z, marker='pup', mec='k', mfc='orange', c='0.75', label='pup')
ax.plot(t, model, c='0.25', zorder=-1, label='standard model')
ax.set_xlabel(r'$\log_{10}({\rm pups})$', fontsize=12)
ax.set_ylabel('Pup density distribution', fontsize=12)
ax.tick_params(which='both', direction='in', labelsize=11)
ax.set_xlim(-1.1, 1.6)
ax.legend(loc='upper left')
plt.tight_layout()
plt.savefig('pup_markers.png', dpi=300)
Which will produce something looking like this: